Preselling and RFO Condos
Fully or Semi-Furnished
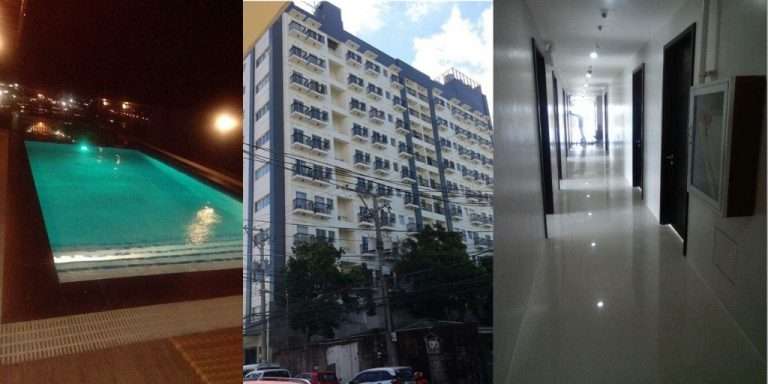
6th Street Lacson, Bacolod City Back of Mc Donald’s 6th street, across Capitol Lagoon Park FULL DESCRIPTION Ready for Occupancy Studio Units in My Van
Here is a list of the most expensive condos in Bacolod by price per square down to the cheapest. Before choosing condos, check out the price per square. Also remember that location matters.
| Project | As of | TCP | Floor Area | Floor | Turn-over | Price per sqm |
|---|---|---|---|---|---|---|
| One Manhattan | March 2021 | 4,837,081 | 33 (Studio) | 3rd | 2023 Q4 | P146,578 |
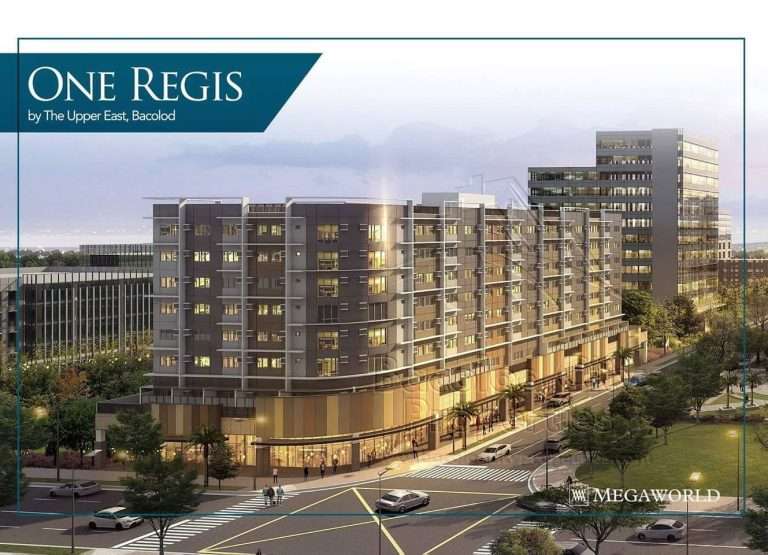
| Two Regis | Jan 2021 | 12,192,000 | 87 (2BR) | 5th | 2022 Oct | P140,137 |
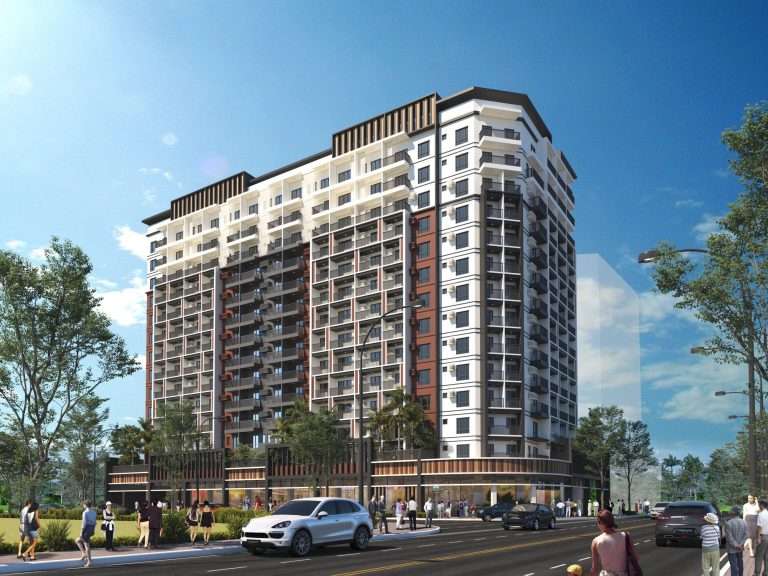
| Rockwell Land | March 2021 | P6,789,792 | 50sqm (1BR) | 3rd | 2023 Sep | P135,796 |
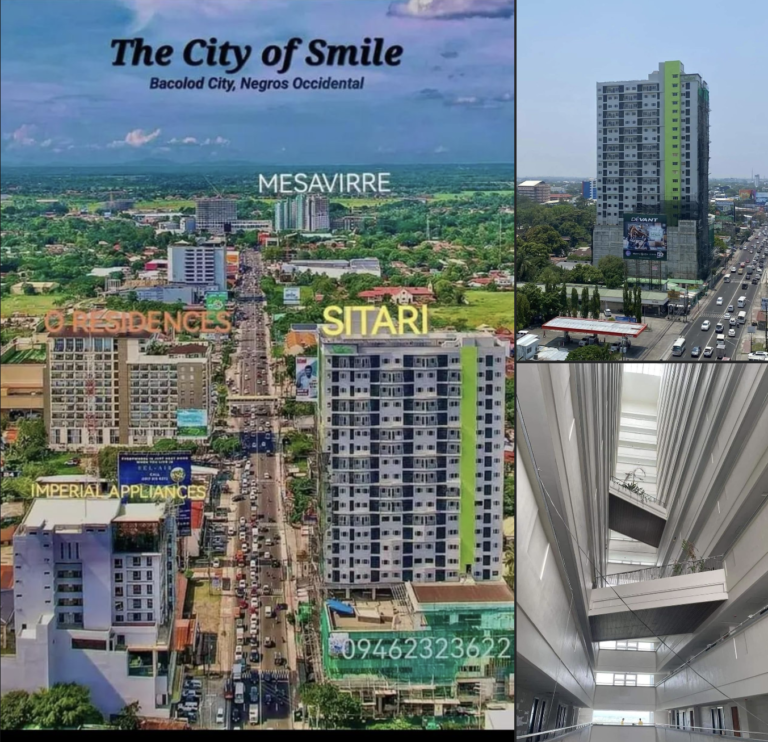
| O Residences (2BR Loft) | March 2021 | 7,284,800 | 69.59 | 15th | Now | P104,681 |
| SDMC Smile | Jan 2021 | P5,103,795 | 28.52 (Flexi) | 4th | 2024 Mar | P178,954 |
| Mesavirre Garden | Mar 2021 | P2,839,722 | 22 (Studio T3) | 3rd | 2022 2Q | P129,079 |
| Camella Manors | Mar 2021 | P4,891,833 | 30.36 (Inner) | 5th | Bldg 1 – now B2 – Q3 2021 B3 – 2023 | P161,127 |
| Sitari | Oct 2020 | P5,100,000 | 50 (2BR) | 12th | 2022 Jul | P102,000 |
Please note that price per sqm comes with other factors such as:
I made this chart to help buyers/investors to make the best decision that suits their needs. But please take note that the figures below rely on various factors such as location, year of completion, developer branding, nearness to key spots, floor level, etc. Contact me to buy a unit.
| Project / PerSq ROI Analysis | Old | New | Difference | Increase (Span) | Per month increase |
|---|---|---|---|---|---|
| Oct 2018 | |||||
| One Regis (2BR - LP-C) | 119,435 | ||||
| Feb 2019 | Feb 2021 | ||||
| Two Regis (2BR 9E)** | 129,194 | 145,884 | 16,690 | 12.92% in 2 yrs | 0.54% |
| Nov 2020 | Mar 2021 | ||||
| One Manhattan (Studio 3F-V)** | 140,722 | 164,857 | 24,135 | 17.15% in 4 months | 4.29% |
| **Please note that pricing per sqm may vary due to unit floor, views, and other factors. Pricing basis are the discounted or NET. Negative growth is because of the discounts due to pandemic. | |||||
| Growth Overall (persqm) | 119,435 | 164,857 | 45,422 | 38.03% in 29 months | 1.31% |
| Total Area | Orientation | Jan 2020 | Mar 2021 | Increase (Span) | Per month | |
|---|---|---|---|---|---|---|
| Studio | 39 | South -2F | 5,081,545 | 5,359,633 | 5.19% in 14 months | 0.37% |
| 1 BR | 50 | South -3F | 6,437,500 | 6,789,792 | 5.19% in 14 months | 0.37% |
| 2 BR | 83 | South -2F | 10,558,015 | 11,090,718 | 4.80% in 14 months | 0.34% |

